Dear Reinhard, Blick, and WeatherCat tinkerers,
I have exactly the same two custom graphs that Blick has. I have two more. I have a weekly wind run graph:
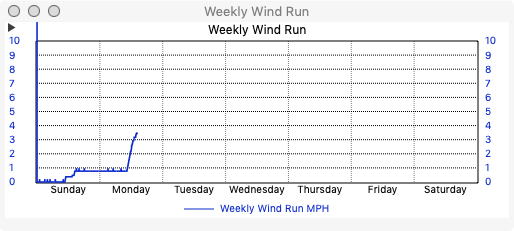
It gives you an idea of how stormy things have been.
The other has both ways of computing evapotranspiration:
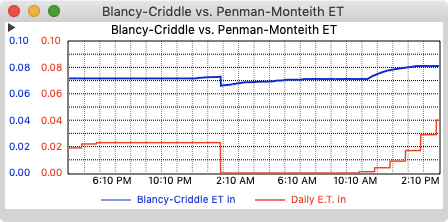
Unfortunately, it hasn't been as useful as I would have hoped. It turns out that I cannot water as much as these graphs suggest. Our water utility already considers us to be rather wasteful water users.
I do have the code for both if they are interesting.
What I would be really interested for is a graph or table or whatelse to show me for example:
ThisYearTemp (min/max/ave fixed graph beginning on 1.1. of the year) vs AllYearsTemp (min/max/ave fixed data from all the years of data before the current year).
Simply impossible? 

At least off the top of my head, I cannot think of any way to do this. However, you can use the STAT$ tag in synthetic channels. If you can come up with a way to represent those two values with a STAT$ query, it might be possible. I'll try to think about it some more to see if it can be done. Certainly, it appears you should be able to create something like it and perhaps that would suffice.
Edouard


