Dear Stu and WeatherCat automated data
"accountants,"Okay, I found the log entries associated with the sensor error event in the early morning hours of November 28th. They are attached to this posting for the curious. However, I've got something else that seems odd, and I don't understand what is going on here. Blick had some confusion about the number of sensor errors on this thread:
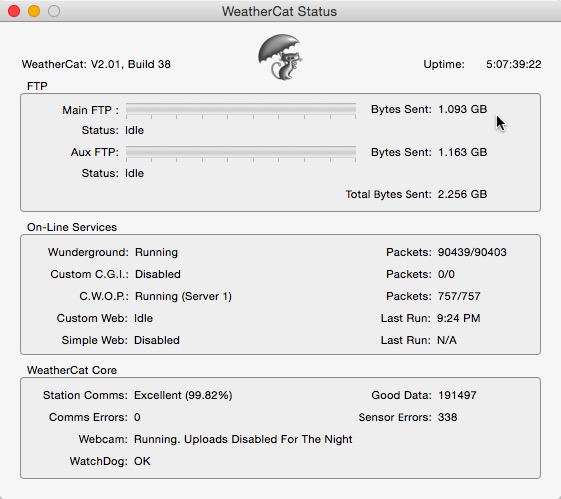
http://athena.trixology.com/index.php?topic=1477.0In that thread he puzzles over the Live Data not looking the same as the WeatherCat Status window. However, Stu concludes that the number indeed are consistent. Okay, I have two episodes. One on the afternoon of the 27th Here is the Status window from that episode:
Here is the Live View window at about the same time:

The WeatherCat status window is reporting 338 sensor errors, but the Live Data only has a total of 110. The overnight incident has a similar discrepancy. Here is the WeatherCat status window:
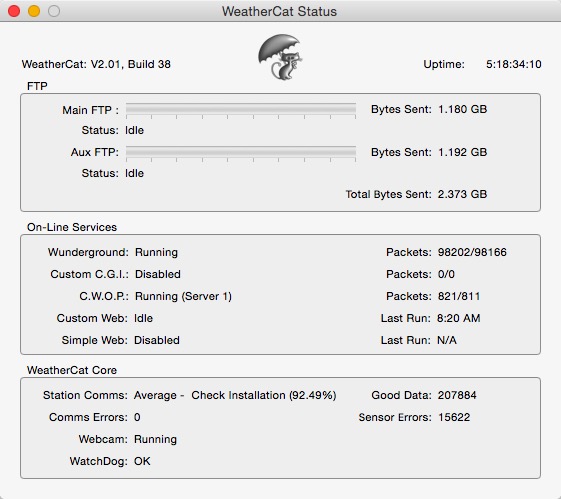
Here is the Live View window:

I'm guessing that the Live View is somehow "live" while the Status window is the cumulative report. So exactly what is the Live View displaying? Over what period of time does it keep the counts?
One other weird thing about my problem is that the email sent by WeatherCat only reports problems with the Thermometer/Humidity unit:
Subject: WeatherCat Admin Alert (Sensor Failure)
To: lwcadmin@canebas.org
From: lwcadmin@canebas.org


Sensor failure at sample time.
Failed sensors are:
External temperature
External humidity


WeatherCat TimeStamp: 00:18:01 28-Nov-14
That suggests the errors start with the Temperature/Humidity probe and only later on does the power situation start to cause errors with the anemometer. However, the Live View lists the number of errors for each sensor as about the same. It would appear at least during the sampling period of the Live View, both sensors were failing at an approximately equal rate.
Anyway, a curious mind would like to know how all this is supposed to add up.
Cheers, Edouard
![[cheers1]](https://athena.trixology.com/Smileys/default/food-smiley-004.gif "Cheers")


