Dear macdengig and WeatherCat
DIY types,
I would like to have a plot of the wind run f (time of day).
I studied all the possible ways to produce graphs in WeatherCat, but could not find any way to do it.
Any suggestions ?
If you simply want a measure of the total wind, there is a way using the WeatherCat synthetic channel feature which is described starting on page 57 of the current WeatherCat manual.
Here is my synthetic channel for a weekly wind run graph:
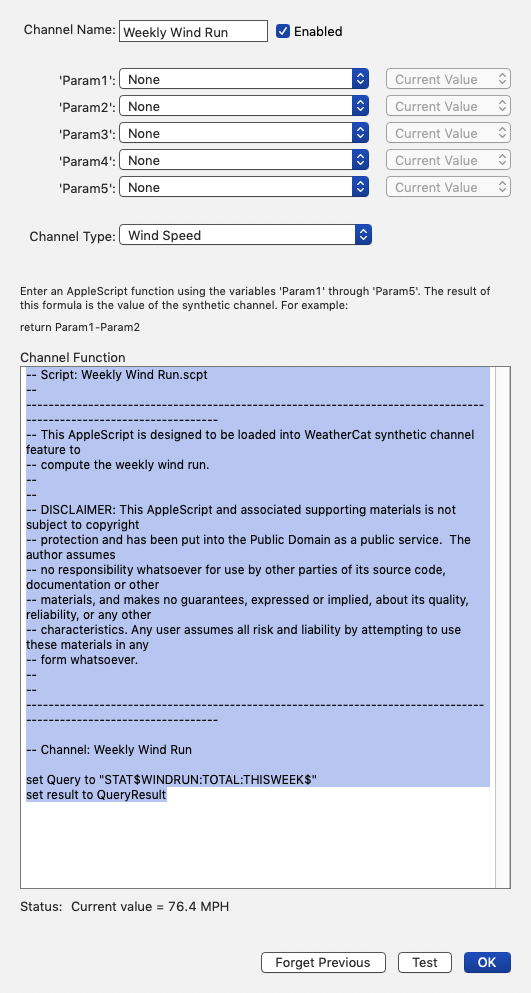
Once you get past the legalize, what is actually doing the work is only two statements:
set Query to "STAT$WINDRUN:TOTAL:THISWEEK$"
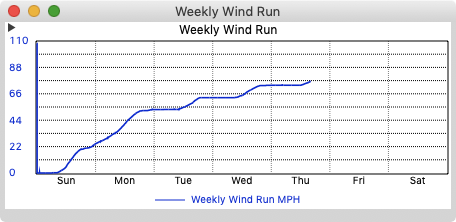
set result to QueryResultYou can graph the synthetic channel like any other source of real data. Here is my graph of the wind run for this week:
You can change the period of the synthetic channel by modifying the
STAT$ tag. It is described starting on page 205 of the WeatherCat manual. If you can seem to figure out how to get the results you want, don't hesitate to ask. The
STAT$ is extremely powerful and therefore a bit tricky to use.
Cheers, Edouard


